Function for plotting shoreline dates along with associated metadata.
shoredate_plot(
  shorelinedates,
  date_probability = TRUE,
  date_probability_scale = 10000,
  elevation_distribution = TRUE,
  displacement_curve = TRUE,
  site_name = FALSE,
  parameters = FALSE,
  isobase_direction = FALSE,
  highest_density_region = TRUE,
  hdr_label = TRUE,
  multiplot = FALSE,
  date_col = NA,
  date_fill = "darkgrey",
  displacement_col = "red",
  displacement_fill = "red",
  site_elevation_col = "#046c9a",
  site_elevation_fill = "#046c9a",
  hdr_col = "black",
  hdr_label_xadj = 0.2,
  hdr_label_yadj = 0.3,
  greyscale = FALSE
)
Arguments
- shorelinedates
Object of class
shoreline_date.- date_probability
Logical value indicating whether the probability distribution of the shoreline date should be plotted. Defaults to
TRUE.- date_probability_scale
Numerical constant with which to scale the probability distribution of the date to make it fit the plot. Defaults to 10000.
- elevation_distribution
Logical value indicating whether the distribution describing the distance between site and shoreline should be displayed. Default is
TRUE.- displacement_curve
Logical value indicating whether the displacement curve should be displayed. Default is
TRUE.- site_name
Logical value indicating whether the name of the site should be printed in the header of the plot. Defaults to
FALSE.- parameters
Logical value indicating whether the parameters of the statistical function should be displayed. Default is
FALSE.- isobase_direction
Logical value indicating whether the direction of the isobases should be printed. Default is
FALSE.- highest_density_region
Logical value indicating whether the 95% highest density region should be displayed. Defaults to
TRUE.- hdr_label
Logical value indicating whether the numeric values for the highest density regions should be displayed. Default is
TRUE.- multiplot
Logical value indicating whether multiple dates should be plotted individually, or be collapsed into a single plot. The only other graphical option with
multiplotset toTRUEishighest_density_region. Default isFALSE.- date_col
Character value specifying the outline colour of the probability distribution of the shoreline date. Defaults to
NA.- date_fill
Character value specifying the fill colour of the probability distribution of the shoreline date. Defaults to
"darkgrey".- displacement_col
Character value specifying the outline colour of the displacement curve. Defaults to
"red".- displacement_fill
Character value specifying the fill colour of the displacement curve. Defaults to
"red".- site_elevation_col
Character value specifying the outline colour of the distribution describing the likely distance between site and shoreline. Defaults to
"#046c9a".- site_elevation_fill
Character value specifying the fill colour of the distribution describing the likely distance between site and shoreline. Defaults to
"#046c9a".- hdr_col
Character value specifying the colour of the line segment giving the highest density region of the shoreline date. Defaults to
"black".- hdr_label_xadj
Numerical value between 0 and 1 specifying the position of the HDR label on the x-axis. Increasing the value moves the label further from the plot border. Defaults to
0.2.- hdr_label_yadj
Numerical value between 0 and 1 specifying the position of the HDR label on the y-axis. Increasing the value moves the label further from the plot border. Defaults to
0.3.- greyscale
Logical value indicating whether the plot should be in greyscale or not. If
TRUE, overrides other colour parameters. Defaults toFALSE.
Value
Plot(s) displaying shoreline dates and associated metadata.
Details
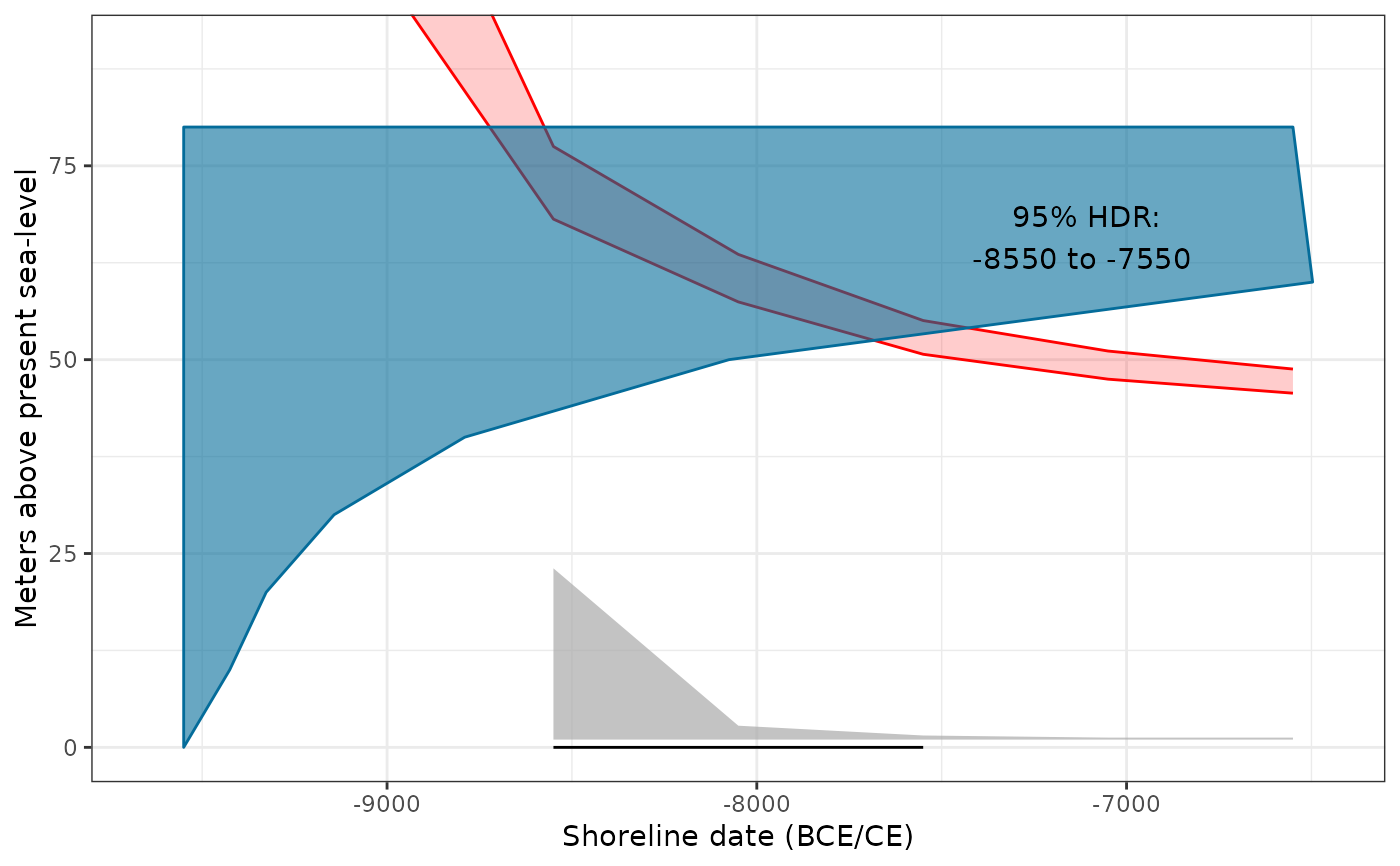
shoredate_plot() returns a plot displaying the provided shoreline
dates. A single plot is created for each date, where a range of settings can
be adjusted to display or hide various parameters and results. Setting the
parameter multiplot to TRUE returns a sparser version for multiple
dates, where the only option is whether or not to display the highest
density region in addition to each date. multiplot does not allow for
multiple isobase directions. Negative values denote years BCE while positive
values denote CE.
Examples
# Create example point with correct coordinate reference system
target_point <- sf::st_sfc(sf::st_point(c(538310, 6544255)), crs = 32632)

# Reduce date resolution with cal_reso and elevation_reso for speed
target_date <- shoreline_date(sites = target_point, elevation = 80,
                              elev_reso = 10,
                              cal_reso = 500)

shoredate_plot(target_date)
#> Warning: Removed 20 rows containing missing values or values outside the scale range
#> (`geom_ribbon()`).