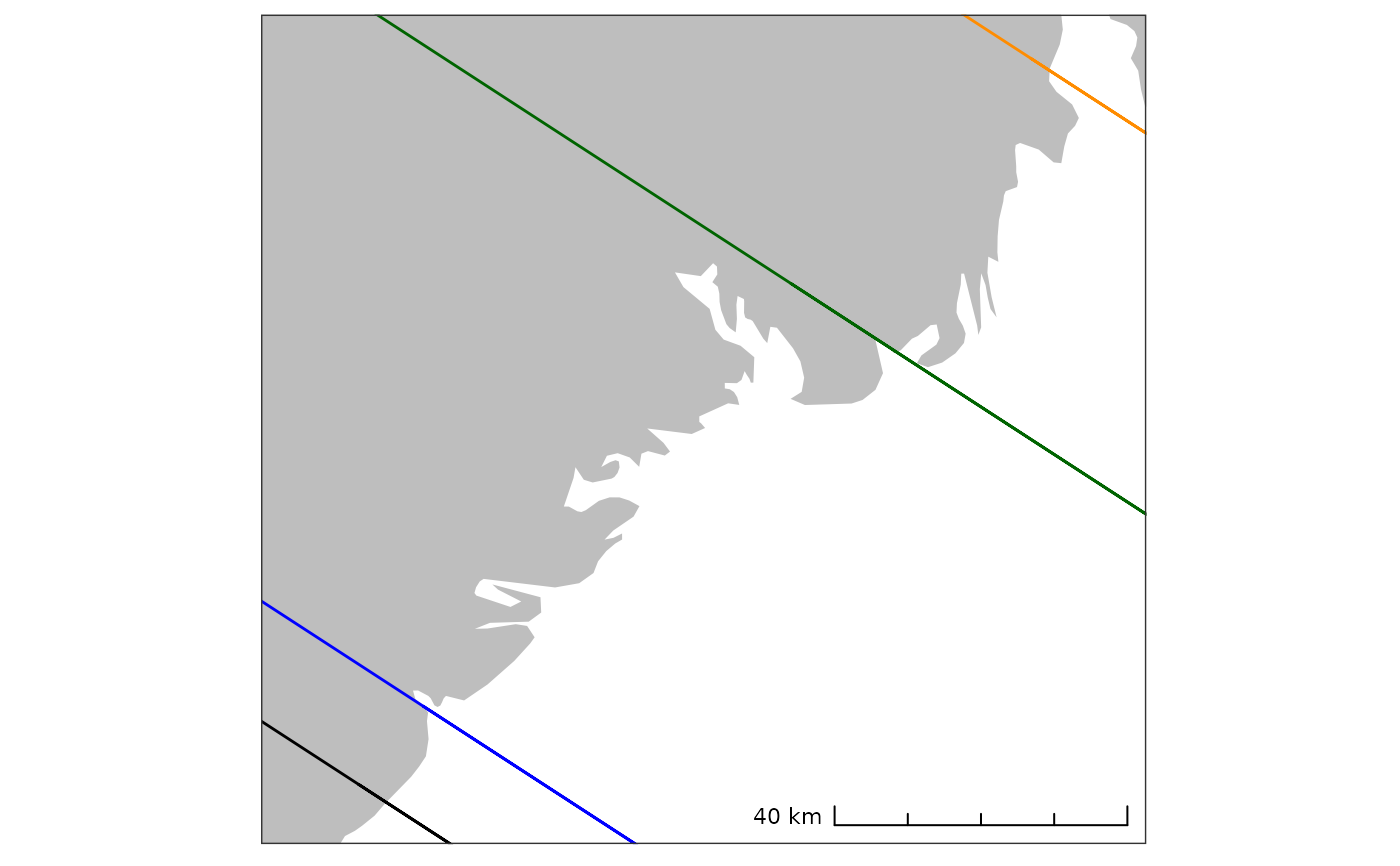
Function to plot the centroids of sites to be dated and shoreline isobases of employed displacement curves on a basemap. Defaults to displaying a light-weight version of the spatial coverage in south-eastern Norway. However, spatial geometries covering other regions can also be provided or temporarily downloaded with the function.
target_plot(
  targets = NA,
  isobases = sf::st_read(system.file("extdata/isobases.gpkg", package = "shoredate",
    mustWork = TRUE), quiet = TRUE),
  basemap = sf::st_read(system.file("extdata/naturalearth_basemap.gpkg", package =
    "shoredate", mustWork = TRUE), quiet = TRUE),
  crs_epsg = 32632,
  naturalearth_basemap = FALSE,
  naturalearth_zoom = c(20000, 20000),
  target_labels = TRUE,
  scalebar = TRUE,
  scalebar_width = 0.4,
  scalebar_style = "ticks",
  scalebar_location = "br",
  base_fill = "grey",
  base_col = NA,
  target_shape = 21,
  target_col = "black",
  target_fill = "red",
  target_size = 2.25,
  isobase_line = c(Horten = "solid", Porsgrunn = "solid", Tvedestrand = "solid", Arendal
    = "solid"),
  isobase_col = c(Arendal = "black", Porsgrunn = "darkgreen", Tvedestrand = "blue",
    Horten = "darkorange"),
  greyscale = FALSE
)
Arguments
- targets
Objects of class
sfrepresenting the sites to be dated. The first column beyond geom is taken as site name.- isobases
Spatial lines as object of class
sfrepresenting the shoreline isobases. Defaults to isobases with a direction of 327 within the spatial limit in SE Norway, butcreate_isobases()can be used to create isobases with other directions that can then be passed totarget_plot().- basemap
Object of class
sfrepresenting a background map. Defaults to a light-weight basemap for the spatial limit in SE Norway.- crs_epsg
Numeric value specifying the EPSG code of the coordinate reference system (CRS) to be used. Geometries with a different CRS will be re-projected. Defaults to 32632, which is WGS 84 / UTM zone 32N (EPSG:32632).
- naturalearth_basemap
Logical value specifying if a background map should be downloaded to be used as a basemap. Downloaded files are stored with
base::tempdir()and deleted when the R session is closed. IfTRUE, overrides thebasemapargument. Defaults toFALSE.- naturalearth_zoom
A vector of two numerical values specifying the amount of cropping that is done around provided
targetswhennaturalearth_basemapis set toTRUE. Be aware of whether a projected or geographical CRS is specified incrs_epsg. Defaults toc(20000, 20000).- target_labels
Logical value specifying whether the targets should be labelled in the plot. Takes the first column beyond the one holding the geometries to represent names. If this is not present the targets are labelled by row number. Defaults to
TRUE.- scalebar
Logical specifying whether a scale bar should be added to the plot. Defaults to
TRUE.- scalebar_width
Numerical value specifying the width of the scale bar by passing it to the
width_hintargument ofggspatial::annotation:scale(). Defaults to0.4.- scalebar_style
Character value specifying the style of the scale bar by passing it to the
styleargument ofggspatial::annotation:scale(). Defaults to"ticks".- scalebar_location
Character value specifying the location of the scale bar on the plot by passing it to the
locationargument ofggspatial::annotation:scale(). Defaults to"br".- base_fill
Character value specifying the fill colour of the basemap. Defaults to
"grey".- base_col
Character value specifying the outline colour of the basemap. Defaults to
NA.- target_shape
Numerical value specifying the point shape that represent the centroids of the targets. Defaults to
21.- target_col
Character value specifying the colour parameter for the points that represent the centroids of the targets. Defaults to
"black".- target_fill
Character value specifying the fill parameter for the points that represent the centroids of the targets. Defaults to
"red".- target_size
Numerical value specifying the size of the points that represent the centroids of the targets. Defaults to
2.25.- isobase_line
Vector of character values specifying the linetype that is used to represent the isobases of the geologically derived displacement curves. Defaults to
c("Horten" = "solid", "Porsgrunn" = "solid", "Tvedestrand" = "solid", "Arendal" = "solid").`- isobase_col
Vector of character values specifying the colours used for the lines that represent the isobases of the geologically derived displacement curves. Defaults to
c("Arendal" = "black", "Porsgrunn" = "darkgreen", "Tvedestrand" = "blue", "Horten" = "darkorange").`- greyscale
Logical value indicating whether the plot should include colours or not. Overrides other graphical parameters When set to
TRUE. Defaults toFALSE.
Value
A ggplot that displays a background map with the location of the shoreline isobases within the spatial coverage in south-eastern Norway, unless geometries for other regions are provided. If provided, the function also plots the position of target locations represented as centroids.
Examples
# Display the background map and default isobases
target_plot()